Create your first status page
Publish a page your customers can check during an outage, built from the monitors you already have.
A status page shows the current state and recent history of the monitors you pick, with your logo and colors. It updates on its own from your monitors' checks, so there's nothing to keep in sync. Every plan includes status pages: 1 on Free, 3 on Pro and 10 on Team.
You'll need at least one uptime monitor or cron monitor.

Step 1 — create the page
Open Status pages in the sidebar and click Create status page.
Enter a Status page name and a Page title, which shows in the
browser tab and in subscriber emails. The URL slug is generated from the name, so
Acme becomes
/status/acme. You can change the slug later.
Click Create status page and the builder opens on the Design tab.
Step 2 — add monitors
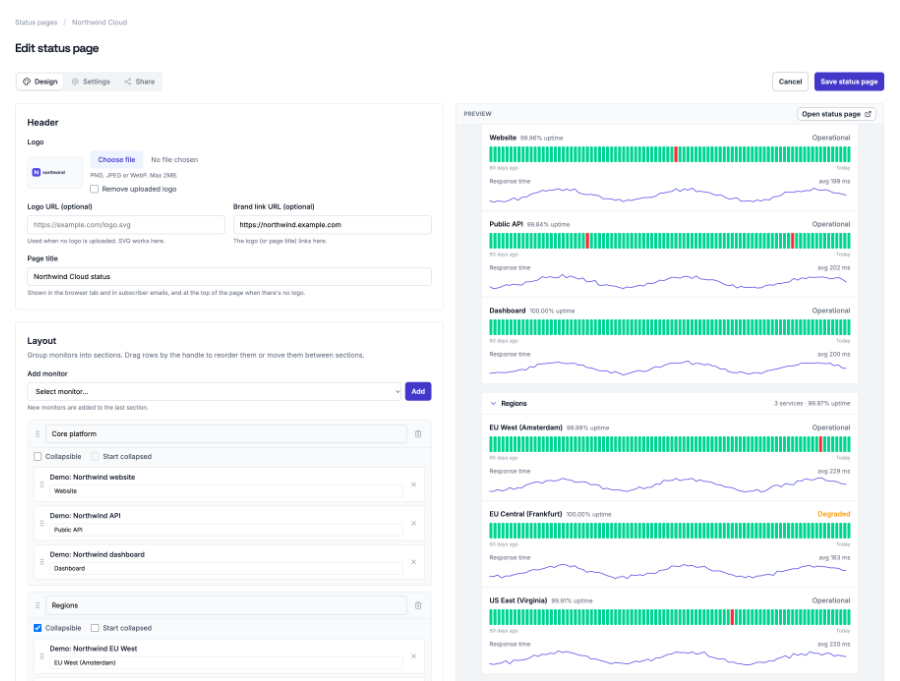
On the Design tab, under Layout, pick a monitor in Add monitor and click Add. Uptime and cron monitors can sit next to each other. Give each one a Public name if its internal name isn't something customers should see, for example Public API instead of api-prod-eu-1.
The preview on the right renders the real page as you type, before anything is saved.
Step 3 — make it yours
Under Header, upload your logo (PNG, JPEG or WebP up to 2 MB) or change the Page title. Under Appearance, choose a light or dark theme, an accent color and a font. There's much more you can change; the customization guide walks through all of it.
Step 4 — save and share
Click Save status page. The page is live at its public address: use Open status page above the preview, or copy the link from the Share tab. Put it in your app's footer, your help center, or your outage replies.
What your visitors see
- An overall status line at the top: all systems operational, degraded performance, partial or major outage, or under maintenance
- Each monitor with its current state and a daily history bar built from confirmed incidents, not from single failed checks
- Incidents you post, with their updates, and maintenance you schedule
- A link to subscribe to email updates, an Atom feed, and the incident history
Start monitoring in minutes
Free plan available. No credit card required.